
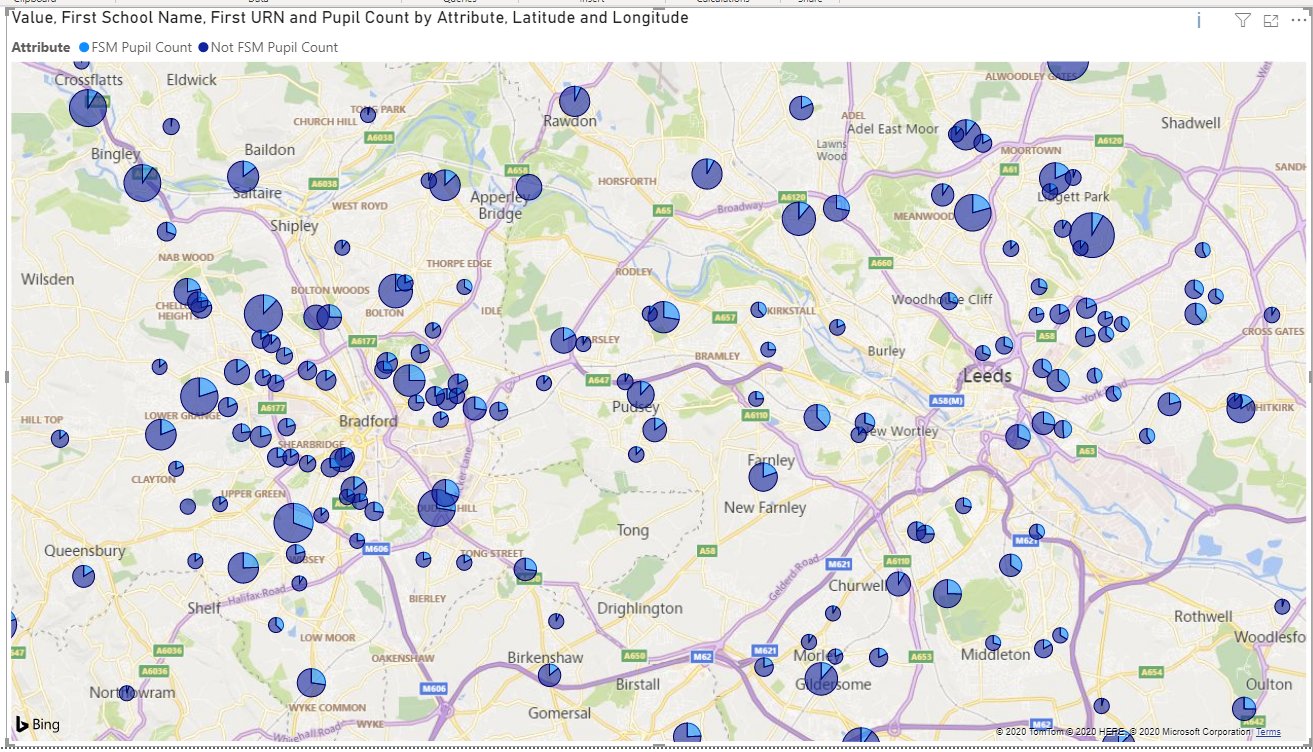
Where pupils in England get free school meals.
, .
Last week I published a blog post on how to work with hosuing data, not in Excel.
Today I'm going to show you how to make maps of where pupils in England are eligible for free school meals. You'll need to have read that last post because I use many of the same techniques.
You need two datasets,
- Schools_Pupils_and_their_Characteristics_2019_pupil_characteristics_UD.csv from the school census. A 2020 version of the data is available, but it was harder to find on gov.uk and I've already written this guide. The data structure has changed but it should work well.
- The ONS Postcode Directory. A link between every postcode in the UK and other geographies.
Load both tables in SQLite
Run this query.
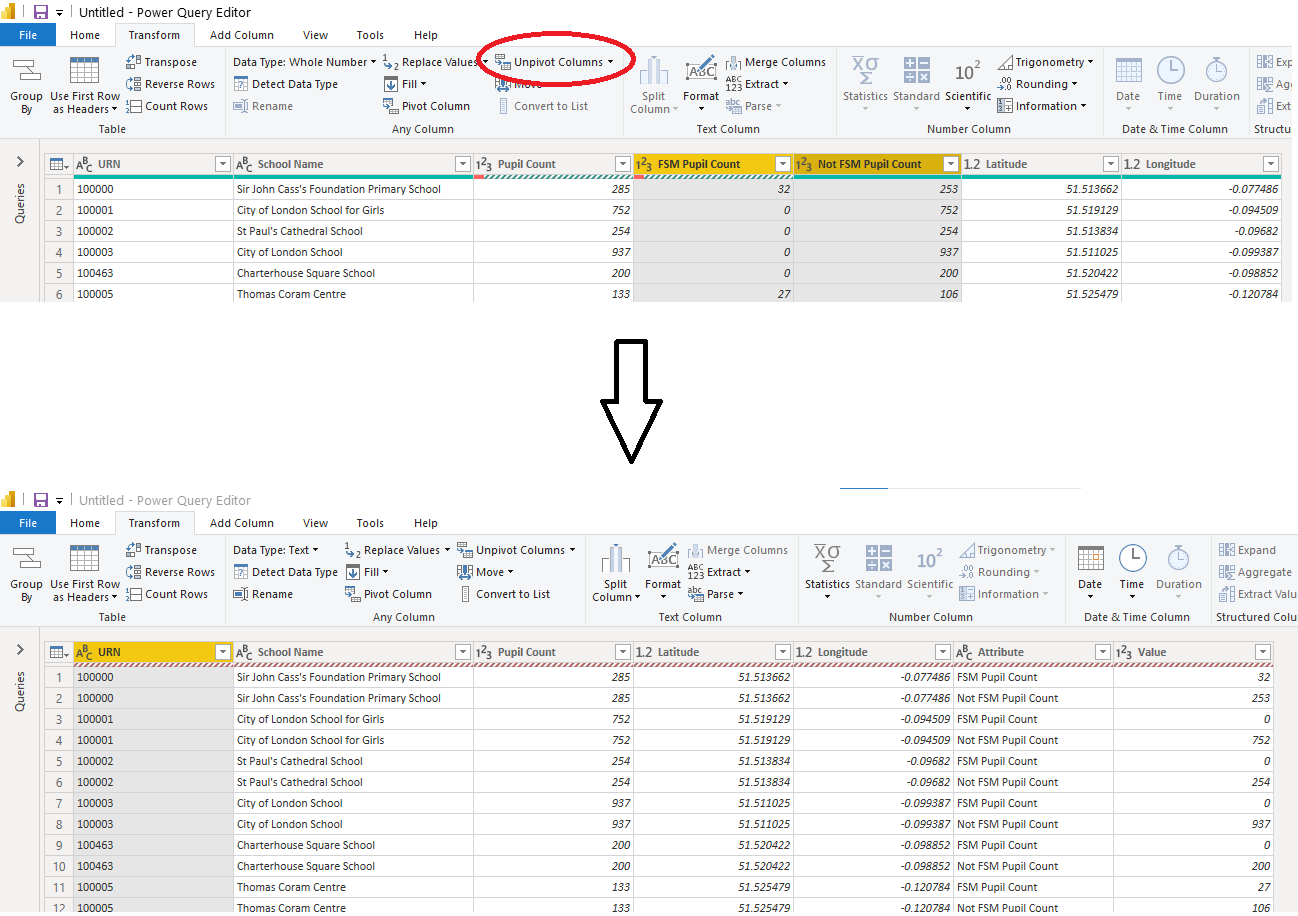
select URN, school_name as [School Name], headcountofpupils as [Pupil Count], numberofpupilsknowntobeeligibleforandclaimingfreeschoolmeals as [FSM Pupil Count], headcountofpupils - numberofpupilsknowntobeeligibleforandclaimingfreeschoolmeals as [Not FSM Pupil Count], lat as Latitude, long as Longitude from Schools_Pupils_and_their_Characteristics_2019_pupil_characteristics_UD join ONS_Postcode_Directory__Latest__Centroids where Schools_Pupils_and_their_Characteristics_2019_pupil_characteristics_UD.school_postcode = ONS_Postcode_Directory__Latest__Centroids.pcds
And export the results.
Now get a copy of PowerBI. You may want to use something more free or more open, but I use PowerBI.
Load the data in, and unpivot two columns, FSM Pupil Count and Not FSM Pupil Count.
And now you're ready to make sweet maps in PowerBI.
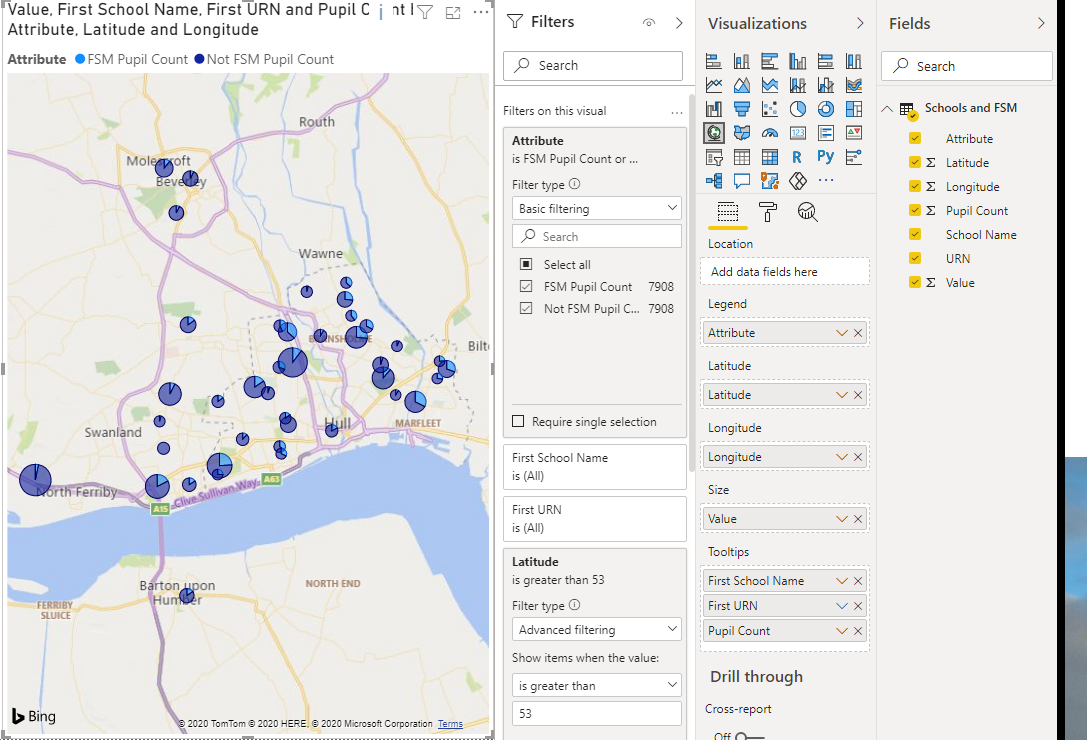
You'll probably want to filter your data a bit by latitude and longitude because PowerBI has the really annoying habit of not showing all your data above a limit without telling you. I'm going to tell them to fix it.